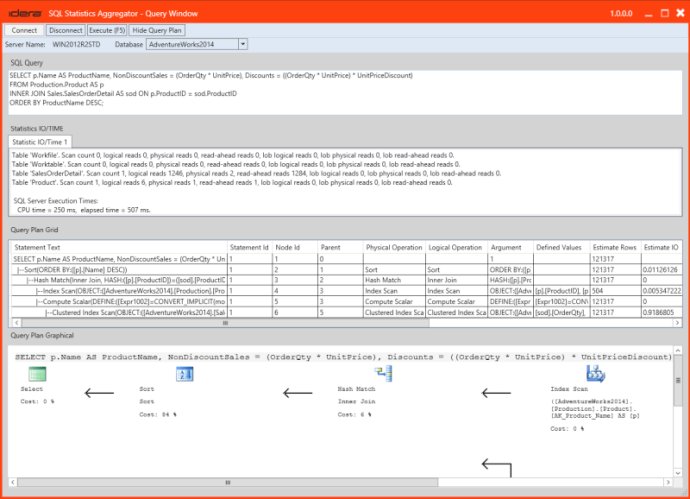
This software aggregates IO statistics to identify problematic tables, correlates disk activity with query plan nodes, and allows comparing runs of a query over time. It also exports and imports results for easy collaboration.

Gone are the days of combing through hard-to-read Set Statistics input/output (IO) and Set Statistics Time performance information to troubleshoot your queries. With SQL Statistics Aggregator, you can compare runs over time with ease and spend your valuable time fixing SQL Server performance issues instead of parsing lines of command results.
One of the key features of SQL Statistics Aggregator is its ability to easily aggregate statistics input/output (IO) data. You can group and aggregate Set Statistics input/output (IO) data by either table or statement, correlate input/output (IO) activity with query plan nodes, and compare statistics over multiple runs of a query to aid in tuning and troubleshooting.
In addition to these powerful features, SQL Statistics Aggregator also allows you to import and export statistics data, export statistics and save tuning sessions to simplify sharing your work with others, and enjoy an elegant design and ease of use. The tool is designed to integrate directly with SQL Server Management Studio (SSMS), so you can launch it within SSMS for optimal usability and efficient workflow.
Finally, you can use SQL Statistics Aggregator for a variety of performance tuning purposes, including identifying which statement in a batch is consuming the most overall input/output (IO), spotting tables that are creating input/output (IO) hot spots in your queries, comparing input/output (IO) to isolate problem operations, and viewing changes to the input/output (IO) patterns.
Overall, if you're looking for a powerful, easy-to-use solution for SQL query tuning, SQL Statistics Aggregator is the tool you've been searching for.
Version 1.0.1.1: This is a new product