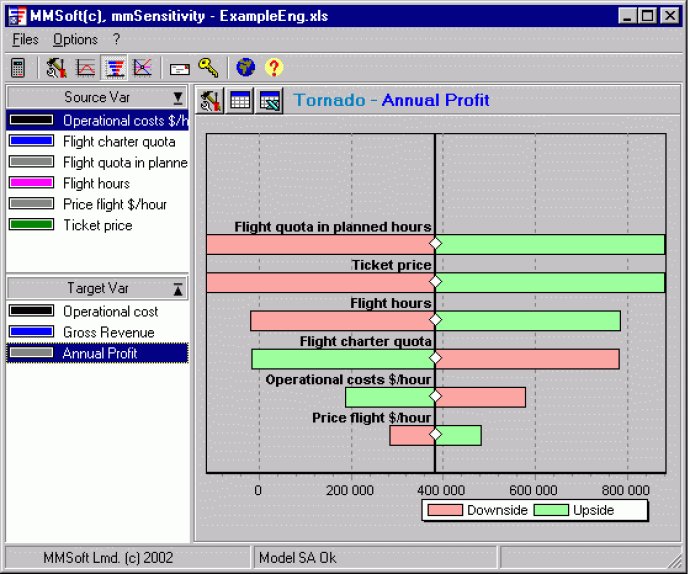
The Sensitivity Analysis add-in for Microsoft Excel Windows versions 97, 98, 2000, and 2001 enables precise sensitivity analysis and fine-tuning of model parameters. Results are presented in charts and tables.

Using this add-in, analysts can perform sensitivity analysis on output parameters of a model based on specific modifications to input parameters. The results of the analysis are presented in a variety of visual formats, such as Simple Plot, Tornado, and Spider charts, as well as tables. Additionally, charts and tables can be exported to MS Excel as a separate worksheet.
One of the key features of the Sensitivity Analysis add-in is its user-friendly interface, which allows analysts to easily select and adjust significant input parameters in models for optimization of target (researched) parameters. This add-in is particularly useful for solving economic, scientific, and technical problems that require the analysis of dynamic behavior of models and the prediction of significances of target parameters dependent on several input data.
Overall, the Sensitivity Analysis add-in for Microsoft Excel is a valuable tool for analysts in the fields of economics, science, and engineering who need to perform sensitivity analysis on complex models. Its user-friendly interface and range of visual presentations for results make the analysis process efficient and effective.
Version 2.07: N/A