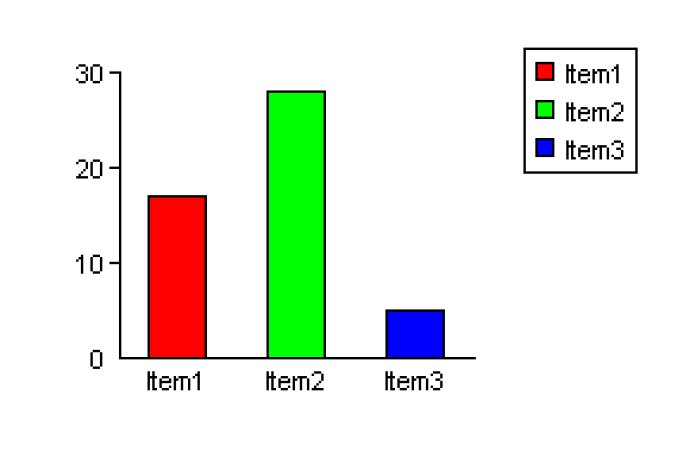
This ASP.NET tool lets you draw bar charts, pie charts, and line graphs instantly. You can either stream the graphs as JPG or GIF files to web browsers or save them to files. The software has properties that allow you to adjust colour, size, and text style.

Users have a wide range of customizable options to adjust color, size, and text style with the ability to utilize built-in defaults to create graphs with just a few lines of code. Furthermore, users can choose to display percentages or actual values and allow the software to randomly generate colors if necessary.
Bar charts have the option for vertical or horizontal orientation, and the stacked bar chart function is also available. Additionally, trend lines and additional plotted lines can be displayed on bar charts. Bar charts and line graphs can auto-calibrate the axes, and all graphs have the option to display legends.
Users can also add additional text and lines to annotate the graph with support for Unicode characters. The software even allows for the creation of HTML image maps. Furthermore, this component can also be used with Windows Forms applications.
Overall, this software is an excellent choice for anyone seeking to create graphs quickly and efficiently, and a free trial is available with full instructions.
Version 1.1: N/A
Version 1.0: N/A