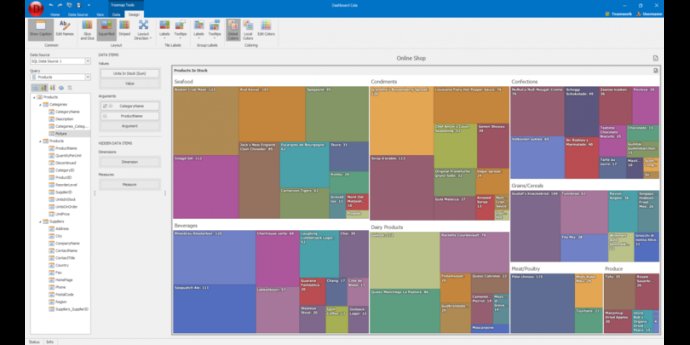
Dashboard Cola is an interactive visualization tool that helps users design dashboards with interactive charting options. Users can click and drill down the data, and charts support various types of interactive displays.

One of the key features of Dashboard Cola is its charting support. This software provides various interactive charting features, including line charts, bar charts, pie charts, tree maps, and global maps. Additionally, Dashboard Cola comes equipped with a built-in master-detail relational database query designer that makes data management a breeze.
One of the things that sets Dashboard Cola apart is its ability to integrate with a wide range of database servers. This feature makes it easy for users to choose the server that best suits their needs.
Furthermore, this software allows multiple users to work on the dashboard design at the same time. Real-time editing means that any changes made by one user are immediately visible to all others. And to make things even more convenient, the dashboard can also be interactively displayed with our free Viewer Cola.
Overall, Dashboard Cola is an excellent software solution that makes data visualization and dashboard designing quick and easy. With its impressive range of features and user-friendly interface, it's a must-have tool for anyone dealing with complex data management tasks.
Version 2.0.0: new release