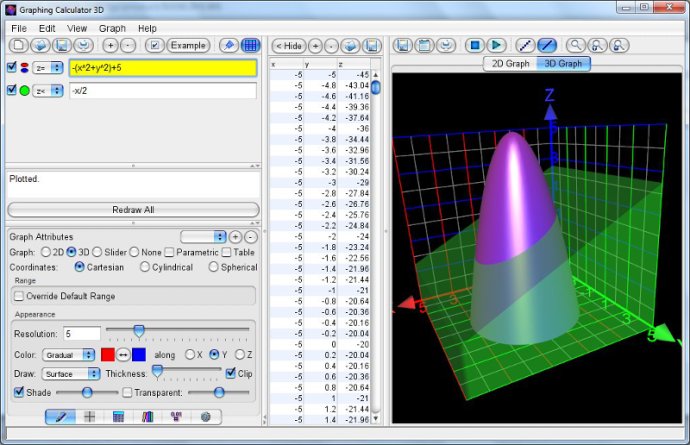
Easily generate high quality graphs of mathematical equations and data using our user-friendly software. Quickly plot functions by entering them in real-time, and the graph updates instantaneously with each keystroke.

This software includes a full set of tools to create stunning visualizations of your data, including an array of features to help you plot 2D and 3D functions, parametric equations, inequalities, implicit equations, and more. You can also generate tables of values, designate Cartesian, polar, cylindrical, or spherical coordinates, import csv and excel files, and even import live data coordinates for quick and efficient plotting.
Plus, with high precision computations, 3D shading and glass effects, and fast rotation and graph animations, you can be sure your graphs will look polished and professional. And when you're done, simply save your graphs as JPEGs and create simultaneous multi-graphs to display even more data at once.
With the power to define your own functions, you can create custom visualizations and gain deeper insights from your mathematical data. So if you're looking for a powerful yet easy-to-use graphing software, we highly recommend trying this program out. It's perfect for anyone from students to professionals looking to make their data stand out with stunning visualizations.
Version 5.1: Support for implicit equations and scatter graphs.