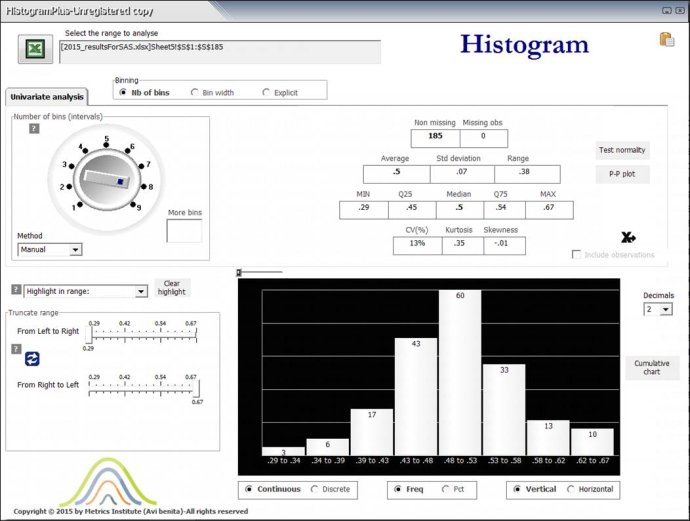
HistogramPlus is a software tool that enables data analysts to easily create Excel histograms and analyze them in depth. With four normality tests and P-P plots for eight distributions, it is a comprehensive tool for data analysis.

That's where HistogramPlus comes in. It provides data analysts with the ultimate "Swiss knife" for creating Excel histograms from data and for performing interactive, in-depth analyses. With four normality tests and eight P-P plots for various distributions, HistogramPlus allows you to select a range of data and generate an Excel histogram with related statistics that are ready for further interactive analysis.
What really sets HistogramPlus apart from its competitors, however, is its innovative approach to dynamic interaction with data through sliders and knobs. This feature enables analysts to uncover previously hidden insights and makes the software a cut above similar tools.
And if you're worried about its performance, rest assured that HistogramPlus has been thoroughly tested against SAS, SPSS, and Minitab. If you want to take your histogram analysis to the next level, give HistogramPlus a try!
Version 1.2: New release