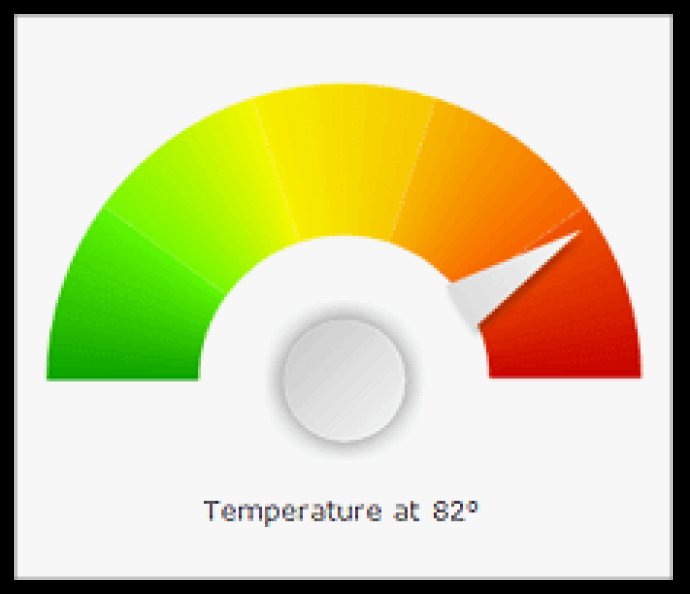
Nevron Gauge for SharePoint is a powerful web component that provides advanced radial & linear gauges, numeric displays, and state indicators. It works based on pivot data aggregation for accurate results.

Thanks to its advanced, pure HTML-based gauge designer, the web part is fully configurable to suit your specific needs. The gauge designer supports all major web browsers and eliminates the need for any plug-ins such as Silverlight or Flash. With no postbacks or MS ASP.NET controls, the communication between the client and server is minimized, and as a result, the design process is significantly faster. The client-side features HTML, CSS, and jQuery JavaScript, while the server-side focuses on pure HTML and script rendering.
The Nevron Gauge for SharePoint comes equipped with numerous features, including multiple gauge areas and combinations, an advanced gauge axis model and scales configuration, advanced Pivot data aggregation, and built-in gauge formulas for data analysis. It also offers an advanced gauge editor, visual styling, and code customization, binding to ODBC, OLEDB, SQL Server data sources, binding to Business Data Catalog and Excel Services, and support for WSS3.0, SharePoint 2007, 2010, 2013, and 2016.
In summary, Nevron Gauge for SharePoint is an impressive software tool that provides an extensive range of features for displaying data within SharePoint environments. With its rich set of linear and radial gauges, numeric displays, and state indicators, this web part is a must-have for professionals who deal with digital dashboards, reports, and KPIs.
Version 2022.1: Improved Performance and bug fixes.