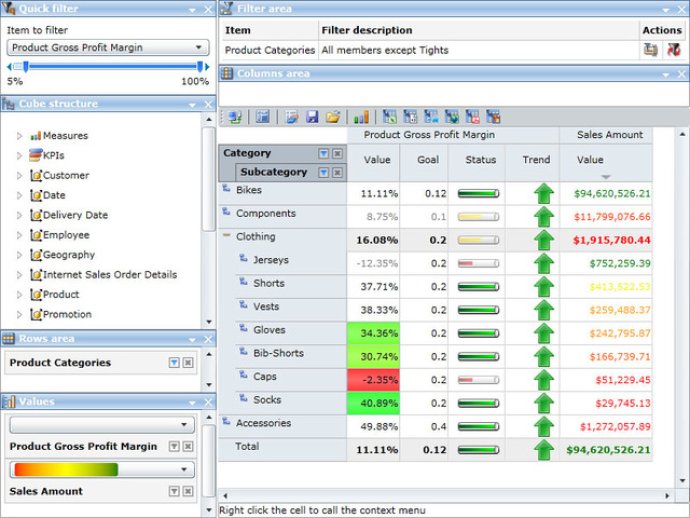
RadarCube offers ASP.NET and Silverlight controls for OLAP Grid and Chart with MS Analysis 2000+ client capabilities. It is a viable alternative to OWC PivotTable for web development.

- Royalty-free!
- Grid and Chart visualization modes 100% managed, no ActiveX code
- All ASP.NET advantages, supporting 100% AJAX or Silverlight
- Supports IE, Firefox, Opera, and Chrome
- Supports the Microsoft Analysis 2000, 2005, 2008, 2012 or local cube files using ADOMD.NET
- Two working modes: cube browsing and displaying the results of any MDX queries
- Ability to create additional calculated measures on the client or server side
- Supports additional calculated members of hierarchies on the client/server side
- Web parts support and Time intelligence support
- Fixed columns/rows headers on scrolling the grid (all browsers)
- Ability to simultaneously display a set of measures, named sets, and KPIs in the Grid
- Interactive drill-down support of all types of hierarchies separately for every grid cell
- Saving and restoring the current OLAP slice
- Member grouping on any hierarchy level without changing the hierarchy levels structure
- Separate hierarchy or dimension sorting on any level, with the ability to override any sorting method
- Ascending or descending sorting based on any column value in the OLAP grid
- Supports filtering of any set of hierarchy members with or without applying these filters in the OLAP calculations
- Auto-filtering of the hierarchy members depending on their values in the grid, with the ability to select some major/minor members, either according to their rank or on the Pareto principle
- Custom rendering in any grid cell
- Custom popup menus in the grid (all browsers)
- Handy integration with charting and other third-party components
- Flexible export to BMP, CSV, GIF, HTML, JPEG, PDF, PNG, TIFF, TXT, XLS, and XML.
In summary, RadarCube's functionality and flexibility make it an ideal solution for managing online data and providing user-friendly analytical reports.
Version 3.21.0:
The main feature of the new release is the new control HTML OLAP Chart that allows visualizing OLAP slices as graphs counting solely on HTML 5 capabilities.
Complete list of changes can be found here: http://www.radar-soft.com/products/rasp_versions.aspx
Version 2.60.1: N/A
Version 2.44.2: N/A
Version 2.43.0: N/A
Version 2.35.0: N/A
Version 2.33.0: N/A
Version 2.31.1: N/A
Version 2.30.2: N/A
Version 1.30: N/A
Version 1.28: N/A