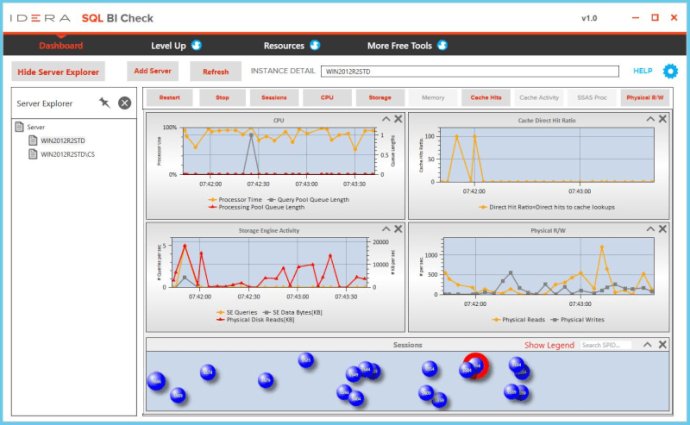
An efficient software tool for real-time monitoring of physical server metrics and analyzing metrics for SSAS processing, memory, and cache of SQL Server Analysis Services. With a setup time of a few minutes, the tool does not require any agents.

Getting started with Monitor SQL Business Intelligence is quick and easy. You can be up and running in just a few minutes, and there is no need to install any agents on your server. Once you’re ready to go, you can set the refresh rate to as low as one minute and view up to two hours of data.
The configurable dashboard provides an at-a-glance view of the metrics that matter most to you. You can see central processing unit (CPU) utilization by percentage, query pool, and processing pool queue lengths. You can also monitor storage engine activity and cache performance.
For analysis services, the tool enables you to view memory in SQL Server Analysis Services (SSAS) specific shrinkable and non-shrinkable categories. This gives you a precise view of the memory utilization of the overall system memory. You can also see SQL Server Analysis Services (SSAS) cache activity and how efficiently the cache memory is being used.
The sessions bubble chart is another useful feature. This displays all active sessions visually by CPU time in bubble sizes and colors that show the most CPU intensive sessions. Hovering over a bubble reveals a snapshot of session and utilization details.
Overall, Monitor SQL Business Intelligence is a comprehensive tool for real-time SQL business intelligence (BI) performance monitoring. With its ability to monitor both physical server activity and analysis services, it provides a complete view of your SQL business intelligence (BI) systems.
Version 1.0.0.22374: This is new product