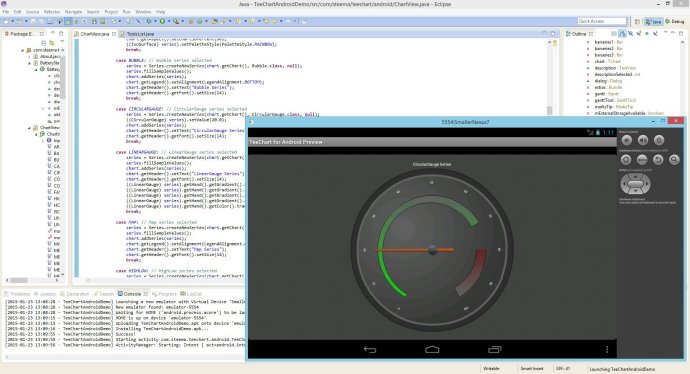
This library provides Java charting components with 50+ styles, 30+ financial and statistical indicators. It supports Swing, SWT, Android and major Java IDEs and Editors. 100% source code is included.

One of the standout features of the Java Charting component Library is that it ships with 100% source code, so you can tweak and customize the library to your heart's content. It's also available in both Swing and SWT formats, making it compatible with a variety of Java programming environments, including Borland JBuilder, IBM Eclipse, Sun NetBeans, IntelliJ IDEA, and Oracle JDeveloper.
Overall, the Java Charting component Library is a powerful and flexible charting solution that's worth considering for your next Java project. With its extensive feature set and compatibility with major Java programming environments, you should have no problem creating compelling, data-driven visualizations that are sure to impress.
Version 2021:
New Series types: BeeSwarm,Horiz BeeSwarm,Violin,Horiz Violin
New function. Kernel Density Estimator (KDE)
Canvas Polygon method index issue
Null points sometimes drawn when FastLine series has DrawAllPoints=false
Erroneous axis label behavior when scrolling with a single value