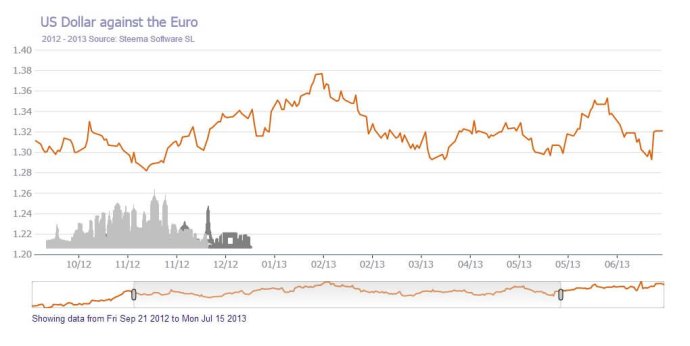
A JavaScript and HTML5 charting tool using HTML5 Canvas that generates native JS format charts and supports all browsers.

Along with its outstanding functionality, this software features an array of chart tools that add extra charting capabilities like annotations, tooltips, cursors, dragging points, sliders, and series scrollers. One of its most outstanding features is that it seamlessly plots graphs across all compatible browsers, including IE 9.0, Firefox 3.6, Chrome 16.0, Safari 5.0, Opera 11.6, Opera-Mini 5.0, Opera Mobile 10.0, Safari 3.2, and Android WebKit 2.1.
It additionally offers zoom and scroll support, various mouse click events, and finger touch support for mobile devices. This flexibility ensures accessibility from anywhere and anytime. With a set of series types and variations, including line, bar, horiz. bar, area, pie, donut, point XY, bubble, candle (financial OHLC), gantt, circular gauge, spark, activity gauge, world maps, polar, polar bar, radar, color grid, and surface 3D, users are guaranteed to find just what they need.
Lastly, it is worth mentioning that this fantastic software is already integrated into leading content management solutions like WordPress, Drupal, Node.js, Joomla, TypeScript, NuGet, and several others. This integration makes it effortlessly accessible to any user, regardless of their technical competence or website platform. Overall, I am pleased with this charting library, making it my top pick for anyone looking for exceptional data presentation tools.
Version 2023: ES6 support
Version 2022: ES6 support