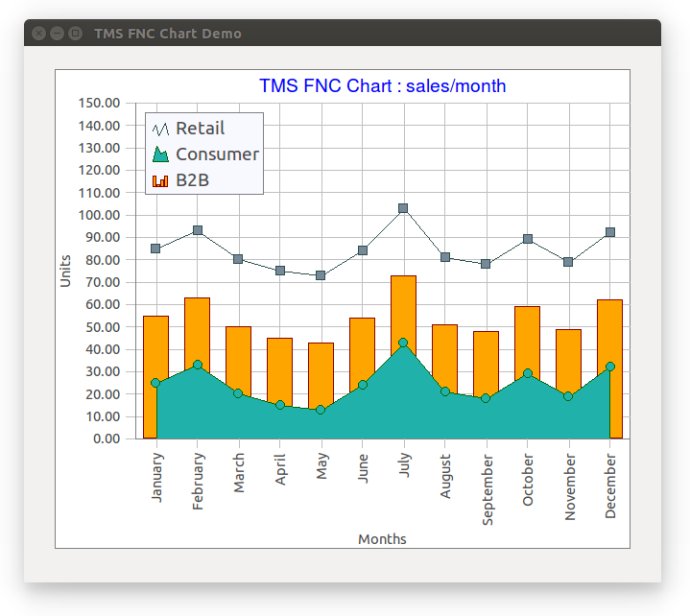
This software is a versatile chart component that works on all platforms and is specially designed for analyzing business, statistical, financial, and scientific data.

One of the highlights of the chart is the support for multiple series with optional separate or combined auto range for x- and y-axis. Additionally, there are bar, grouped bar, absolute stacked bar, percentage stacked bar, area, stacked area chart types, pie, donut, spider, line and digital line chart types, XY line and XY scatter chart types.
The chart also comes with a legend that has a glyph representing the chart type for each series. The formatting of values in various formatting types like numbers, floating-point numbers, and date time is also supported. The X-axis and y-axis can have optional custom formatting for each series and multiple position support.
Design-wise, there is an optional configurable background grid, series markers with bitmap and custom drawing support, series labels with formatting support and optional stacked mode, and annotations for each series point. There is also an optional 3D drawing mode which can come to your aid.
You can access the Design time editor for further customization, and there is a separate runtime editor for desktop operating systems. The chart supports a high number of events for further customization and comes with opacity support (FMX only).
Overall, this is a fantastic cross-platform chart with a range of features that make it a great choice for any developer looking for a configurable chart to use in their software.
Version 1.0.0.1: Improved : AddPointArray for quickly adding an array of singles