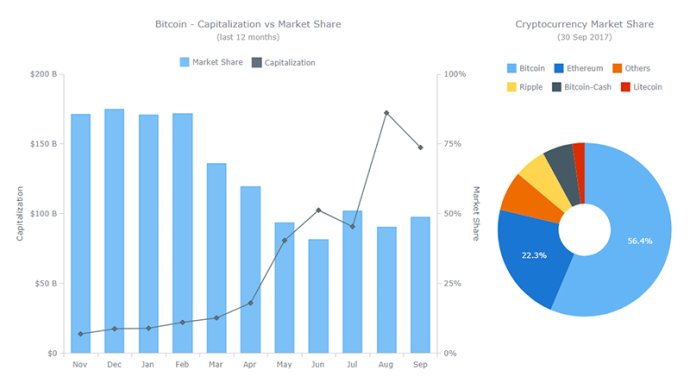
AnyChart is a versatile JS chart library that enables the creation of interactive charts across various browsers and platforms. It is reliable, flexible, and does not require dependencies. The library offers a range of charts types, such as bar, area, pie, and more, to be incorporated into any app or website effortlessly.

What sets AnyChart apart is its robust JavaScript API that makes it possible to create big data-based charts in real-time with continuous updates and multi-level drill-downs. Additionally, it supports all server platforms and databases, making it a versatile and reliable choice.
The library offers a wide variety of chart types, including scatter, line, bar, area, waterfall, spline, funnel, bubble, polar, column, column range, pie, box plot, linear and angular gauges, area spline range, Mekko, Venn, Sankey Diagram, waterfall, quadrant, tag cloud, and many more in 2D and 3D.
One of the main advantages of using AnyChart is its out-of-the-box features, including 60+ chart types, chart design themes and color palettes, chart export to PDF, PNG, JPG, SVG, PS, chart data export to CSV and XLSX (Excel), social network sharing, many web app samples with interactive BI dashboards, localization engine (194 predefined locale files), advanced interactivity (tooltips on hover, drill-down, exclude data point, multi-selection, and more), multiple axes, async rendering, online chart editor, and much more.
In summary, AnyChart is an excellent choice for developers who want to create beautiful and interactive JS data visualization for any web projects. With its extensive features and ease of use, it provides a great way to impress and engage customers with informative charts and dashboards.
Version 8.7.0: Client-Side Export is now available in the AnyChart JavaScript charting library. This will allow you to have your data visualizations saved as images — SVG, PNG, and JPG — and PDF documents without a roundtrip to the server by leveraging the built-in browser features for a seamless JS chart export.