This software provides a real-time ActiveX chart control that comes with built-in tools intended for technical applications.

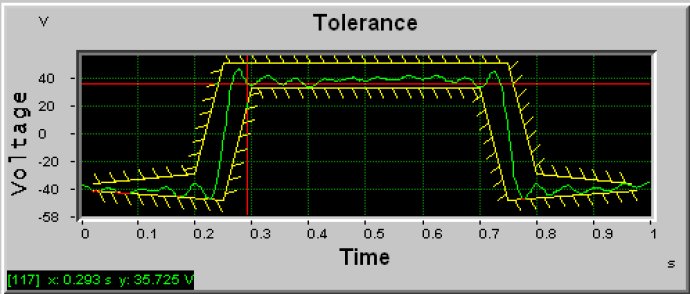
One special feature that sets DynaPlot apart from its competitors is its tolerance masks. You can add upper and lower tolerance curves to test your data in real-time. The software also highlights tolerance violations, and your client application can take action depending on the verdict.
Here are the key features of DynaPlot:
- Line, bar, and scatter plots
- Dynamic scaling of chart elements with window extent
- Built-in keyboard and mouse navigation tools (scroll, pan, zoom, auto scale, and cursor functions)
- Limit lines and tolerance masks with highlighted tolerance violations for T&M applications
- Linear and logarithmic scaling
- Automatic grid lines, time/date, and engineering formats
- Custom scale annotation
- Real-time programming support
- Data curves and data bitmaps in one chart
- Any number of named markers
- Charts can be copied to clipboard or saved as bmp-, or compressed PNG-encoded files for server applications
- Comprehensive, yet easy to learn programming interface.
Overall, DynaPlot is a powerful software for test and measurement applications. Its features cater to your specific needs, and the programming interface is easy to learn. The software offers flexibility and efficiency, making it a perfect fit for your charting needs.
Version 3: N/A