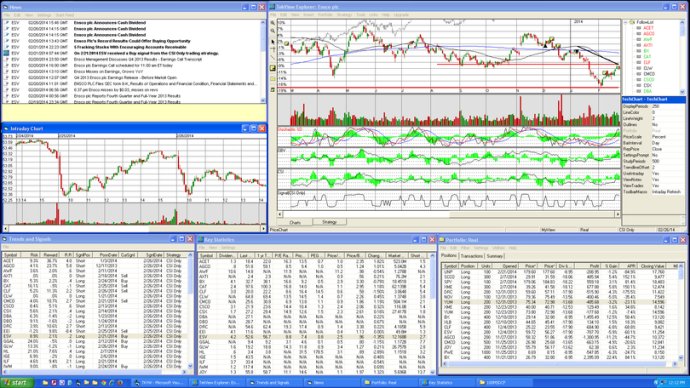
This software offers advanced stock charting tools, technical analysis, and custom indicators to help investors make better trading decisions. It also includes a portfolio evaluator, Petri net decision rules, and automated fuzzy logic back-testing for more accurate results.

For more advanced customization, TekView Explorer has a drag-and-drop feature that allows you to create custom indicators without the need for coding. Also, you can access a scripting interface that supports Microsoft's VBScript and JScript.
One of the unique features of TekView Explorer is the use of Petri nets to model fuzzy logic decision rules, which you can apply to automatically backtest any number of stocks. Real and hypothetical transactions are stored in portfolios, and the portfolio interface and charting interface complement each other, making the review and assessment of trading patterns convenient.
TekView Explorer includes a portable back-end and data management tools, making it easy to work on multiple devices. The software provides free end-of-day and real-time price updates obtained from the internet, ensuring that you have access to the latest information.
Overall, TekView Explorer is a valuable tool for traders of all levels, offering a comprehensive range of features to help you make informed trading decisions. Its easy-to-use interface and customizable options set it apart from other technical analysis tools in the market.
Version 2.1: Intraday updates, enhanced trend line methods, news feed, earnings calendar, automation