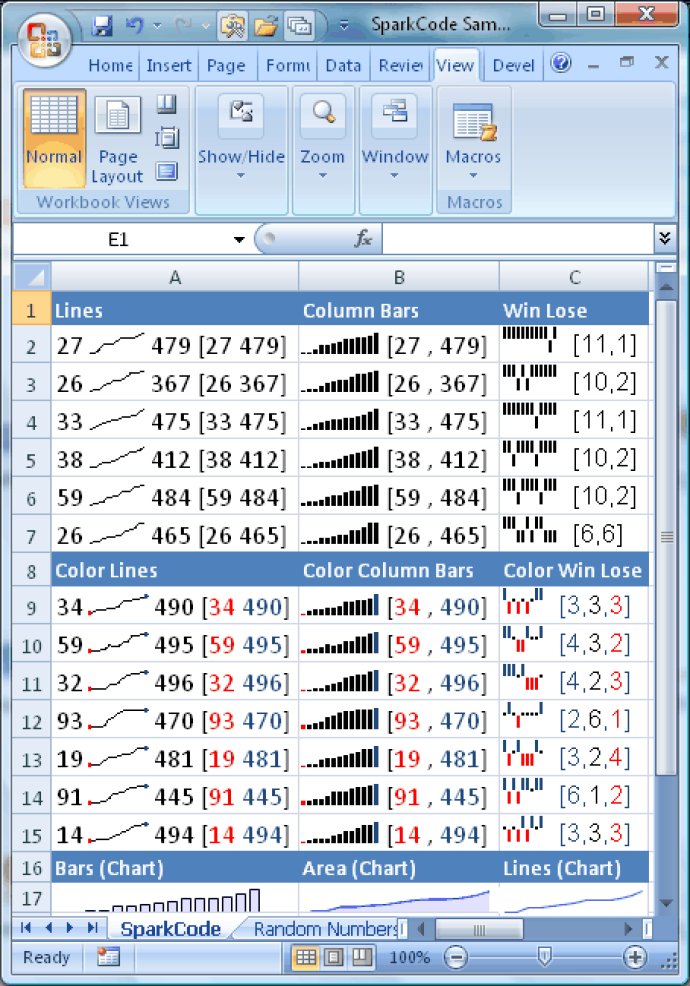
SparkCode Professional is an Excel add-in that enables users to generate sparklines, compact and data-rich graphics using TrueType fonts. It is ideal for creating dashboard reports and effectively visualizing data.

With the SparkCode software, you can create high-quality dashboard reports in just a few easy steps. The interface is user-friendly and guides users through the process, allowing them to customize their charts with a variety of options. The graphics are implemented as font glyphs, which makes them easy to use with third-party software that supports text and fonts. This means that the charts are about the same size as the text they accompany, making it easy to present them elegantly by embedding them in a paragraph.
SparkCode Professional comes with a wide range of features that allow users to:
1) Produce compelling, data-dense graphics condensed into a single cell or the size of a word
2) Consolidate all of your data using different tiny graphics into a single worksheet
3) Get all of the information you need on a single screen
4) Visualize large volumes of data for different scenarios
5) Compare and identify trends to gain a better understanding of the bigger picture
6) Create various graph types such as sparklines, columns, bullet graphs, and bar graphs.
Whether you're an Excel pro or a novice, SparkCode Professional makes it easy to create professional-quality dashboard reports with powerful and compact graphics. With its intuitive interface and easy-to-use features, this tool is a must-have for anyone looking to make sense of huge datasets and present them in an elegant and effective way.
Version 2.0: New release