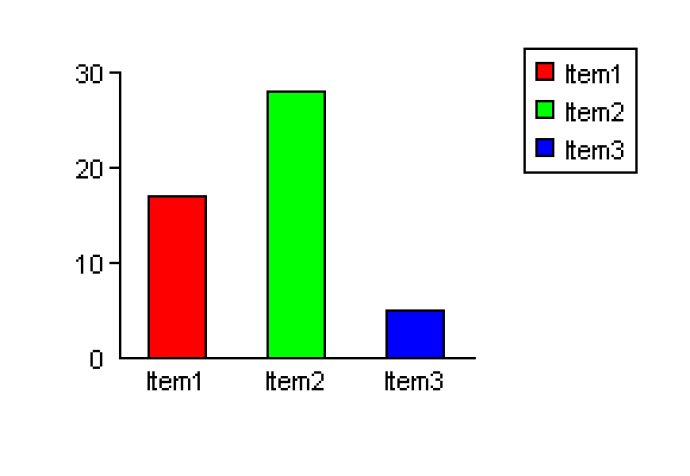
This ASP component generates pie and bar charts as well as line graphs in real-time. The output formats include GIF, PNG, JPG, and BMP. Output can be viewed in-browser or saved as a file. Various properties are available for customizing chart features, such as size, color, and text style.

This software product supports a range of image types, including GIF, PNG, JPG, and bitmap. Additionally, users can customize the colors, sizes, and text styles of their graphs via a wide range of properties. Built-in defaults mean that even users with minimal programming experience can produce graphs with only a few lines of code.
One of the standout features of this software is its flexibility when it comes to displaying information. Users can choose to show percentages or actual values on their graphs, and even generate colors randomly if they prefer. Bar charts can be oriented vertically or horizontally, and a stacked bar chart option is available. Trend lines can be shown on bar charts, as well as additional plotted lines. Bar charts and line graphs can auto-calibrate their axes, and all graphs can show legends.
Moreover, users can add additional text to annotate the graph, and this text supports Unicode characters. HTML image maps can be produced for further customization. Finally, users can try this software for free with full instructions, and can choose between 32 or 64 bit versions.
Overall, this software product is an impressive and versatile tool that makes it easy to create professional-quality graphs quickly and easily. Its many features ensure that users can customize their graphs to meet their specific needs, and its user-friendly interface makes it accessible even to those with little programming experience.
Version 3.1:
Export to Base64 added.
Links updated to https.