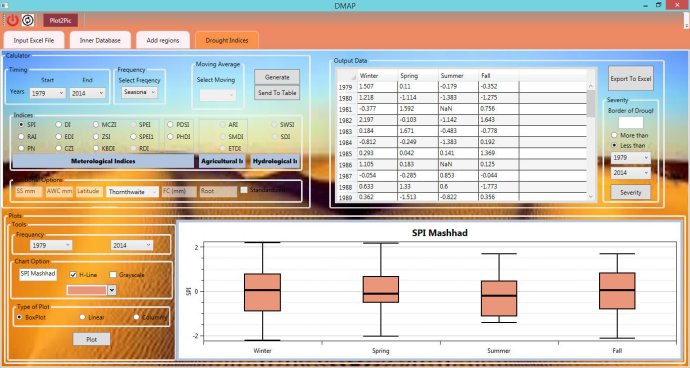
The DMAP software can calculate drought indices in three types of drought: meteorological, agricultural, and hydrological.

To get started with DMAP, simply follow a few easy steps. In the monitor phase, select the desired index and let the software do the calculating for you. Then, view the available graphs - including line, columnar, and Boxplot - to monitor the drought event in various time scales in your area of study.
Looking to predict future drought trends? The prediction phase of DMAP lets you import downscaled outputs of GCMs models to calculate the indices that matter to you for a future period.
DMAP also offers unique features that set it apart from other software tools. For example, it accepts input files in various formats, including csv, xls, xlsx, and NetCDF. Plus, the software doesn't require a specific ordering of data in columns - it recognizes the location of the data based on the input column header.
If you've had trouble with other software tools that only compute a few indices, the flexibility of DMAP is sure to impress. Simply select the header of each column to easily determine the order, and get the data you need without any hassle.
Version 1.0: N/A