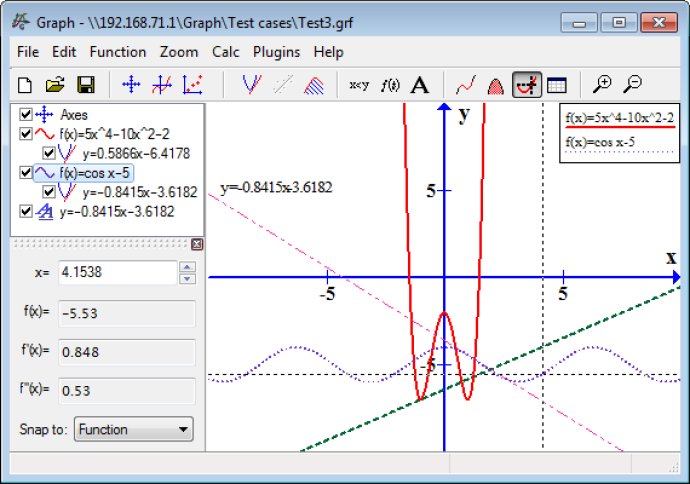
Graph is a software that helps draw mathematical graphs on a coordinate system. It allows users to use various colors and line styles, evaluate a function at a point, and trace the function using the mouse.

One of the most impressive features of this program is the ability to evaluate a function at a point or trace the function with the mouse. This feature offers tremendous flexibility in exploring and analyzing specific parts of a mathematical function.
Additionally, users can add shadings and series of points to the coordinate system, and even add trendlines to point series. This function allows for a deeper level of analysis and can help users identify patterns or trends in their data.
Another great advantage of this software is its image-saving function, which allows users to save the entire coordinate system and everything on it as an image file for future use. Moreover, users can copy images into another program, making it easy to integrate graphs into presentations or papers.
Finally, text labels may also be placed anywhere in the coordinate system, which adds an extra layer of context and clarity to the graphs. In conclusion, this software is an excellent choice for anyone looking to create professional-looking and detailed mathematical graphs.
Version 4.4.2: Bug fixes