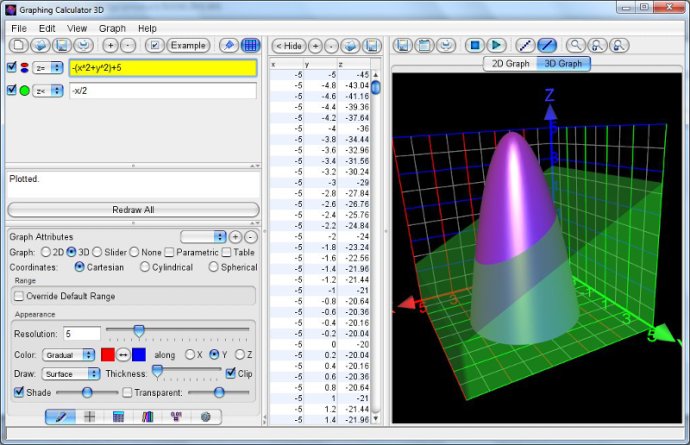
This software allows users to create high-quality graphs of mathematical equations and data quickly and easily. Users can simply input a function, and the graph will update instantly, making it an efficient tool for visualizing data.

Our software is equipped with a rich set of tools that can help you create the perfect visualization of your graphs. You can plot various types of equations such as 2D & 3D functions, implicit equations, parametric equations, inequalities, 3D scatter points, contour graphs, and more.
The software also allows you to generate tables of values in various coordinate systems such as Cartesian, polar, cylindrical, and spherical. You can even import CSV and Excel coordinates or live data coordinates for added convenience.
One of the standout features of this software is its high-precision computations. You can trust that your graphs will be accurate and reliable. Additionally, the software has 3D shading and glass effects, fast rotation and graph animations, and the ability to save graphs as JPEGs.
Simultaneous multi-graphs are also supported, allowing you to compare and contrast multiple graphs at once. You even have the option to define your own functions for added customization.
All in all, this software is a great option for anyone in need of a reliable graph plotting tool.
Version 5.1: Support for implicit equations and scatter graphs.