GoldenGem software, used by top traders in the past, is now available for download and math data testing. The user can access the software through the File menu.

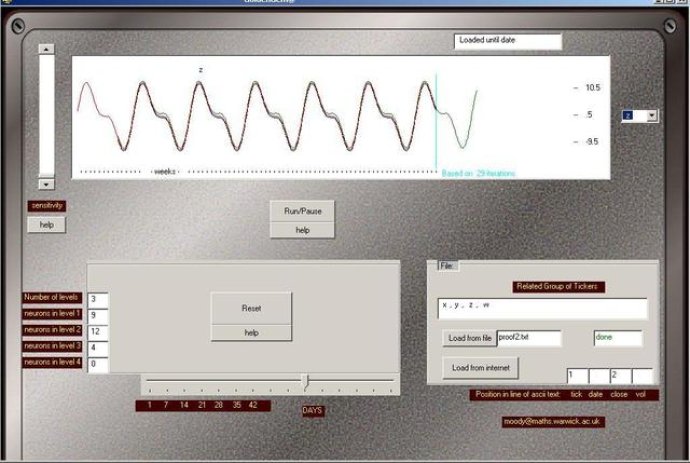
You can see the results of these calculations in the software's screenshot. GoldenGem predicted the values perfectly, giving you a convincing reason to try it out. You can achieve this result yourself by downloading and running the software with the test data file provided.
To run the test, simply enter x, y, z, or w in the ticker window and browse to the test file. You can also enter real tickers and click on 'Load from Internet' to use real stock data, which the software will analyze for mathematically significant relationships. If there is any such relationship, GoldenGem is very likely to find it.
The software offers two sets of controls: a horizontal slider to select the number of days to look ahead, and a vertical slider to adjust sensitivity. In predicting the math functions, we left the sensitivity slider in the default position, and it took dozens of iterations to train GoldenGem.
The software displays a green trace that represents the neural net's attempt to match the blue curve. The blue curve is based on all the prices and volumes loaded from the earlier time specified by the red trace. You can raise the sensitivity until the green and blue curves begin to match, and leave it running for a while. After some time, you can lower the sensitivity. If the green curve still matches the blue curve, this means the neural net can match the advanced blue curve based on loaded prices and volumes from the earlier time. It can continue this calculation for an equal number of days into the future and therefore give you an opinion about the selected ticker at that time.
Version 1.4: N/A