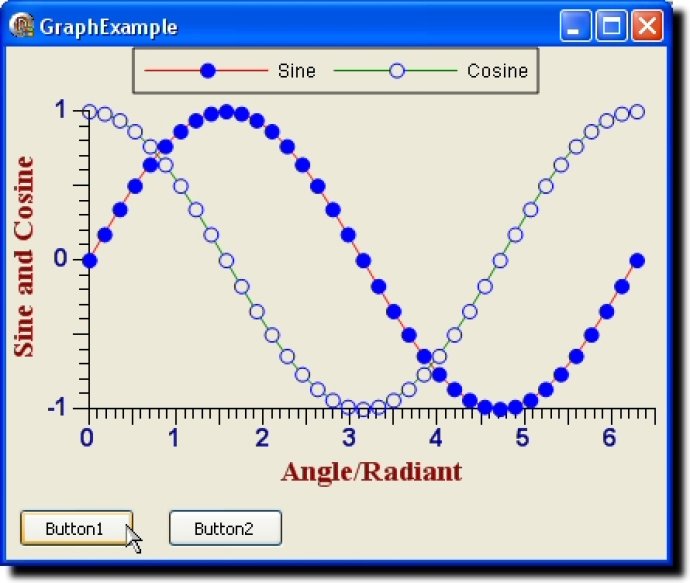
This software enables users to create two-dimensional cartesian plots with an unlimited number of axis, automatic scaling and zooming, and manifold line and point styles. It includes options for an unlimited number of series and secondary axis.

With support for different axis scaling types, series, calculated line legends, movable markers, and more, this powerful tool makes it easy to generate financial and scientific graphing programs in no time. The process of creating arrays is as simple as plotting, thanks to the user-friendly interface, and you can customize the end product to the needs of your customers.
Whether you're developing online data acquisition graphing or stock charting applications, this software has got you covered. It comes loaded with an unlimited number of secondary axis, lines, point symbols, error indicators, arrows, bars, bubbles, OHLC (western plot), candle stick, and many more features to make your plotting experience smooth and effortless.
Additionally, this innovative tool supports linear and non-linear regression, interpolation, differential, and integral, among others, which makes it an ideal solution for precise scientific computations.
Other key features that make this software appealing are its auto-updating, auto-scaling, and auto-zooming capabilities. The software also features movable markers, automatic calculation results in labels, editors with enhanced options, color and style selectors with unique PropertyLinks, and more, which help you set properties without writing a line of code.
In conclusion, this plotting software is an excellent addition to your financial and scientific plotting toolkit. With its user-friendly interface and numerous customization options, you can quickly generate robust and reliable plots that meet your customers' requirements. Try it out today and experience a revolutionary plotting experience like never before!
Version 3.3.2.29: 3D Bars