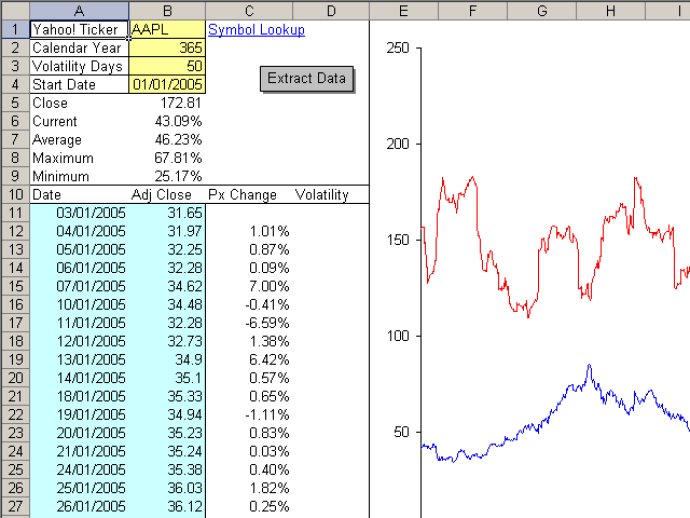
This free software enables users to download historical stock data from Yahoo and calculate the historical volatility of a selected stock. It also offers a graphing feature to visualize the results.

One impressive feature of the tool is the way it plots the standard deviation of prices alongside the stock price chart. This makes it easy for users to visualize price fluctuations and identify trends accurately.
Users also have the flexibility to customize certain aspects of the data analysis to match their preferences. They can adjust the date range used for the stock data and set the number of days back to use for the volatility calculation. Additionally, the tool allows users to select the number of volatility days to use.
Overall, this software is an excellent choice for anyone interested in analyzing stock market data. It's user-friendly, provides detailed insights, and offers a high level of customization.
Version 1: Version 1 - No Changes