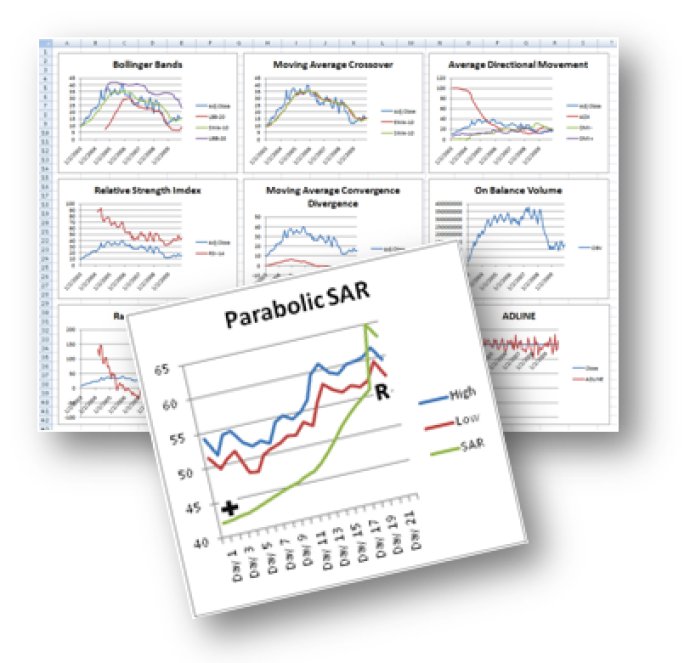
TraderCode is a versatile software for stock traders that allows them to compute technical indicators and plot them directly in Excel. With an intuitive interface, its Excel Add-In enables quick calculations and better decision-making.

The foundation of TraderCode lies within its Technical Analysis Add-In and Formulas. Since the first version of the software, this Add-In has allowed users to easily and efficiently create technical indicators through a user interface wizard. Additionally, it offers data validation, precise output specification, and accurate indicator creation guidance, making it accessible to those with no prior experience.
The Analysis Expert is another great feature that allows traders to create their own trading system by combining various technical indicators. Within a spreadsheet environment, users can quickly and easily download data, create multiple technical indicators, vary the parameters, and repeat tasks with just one click. The Analysis Expert enables repeatable analysis on different stocks with ease.
The Backtesting Expert is a spreadsheet model that offers traders the ability to create trading strategies using technical indicators and run them through historical data. This feature allows for easy and quick performance measurement and analysis.
Finally, the Point-and-Figure Charting Expert is a popular analysis technique among traders and investors. This method uses a chart with "X"s and "O"s to predict financial asset prices. TraderCode provides this tool to its users with ease and accessibility, making it a comprehensive software library for traders of all levels.
Version 5.0: Pivot Points