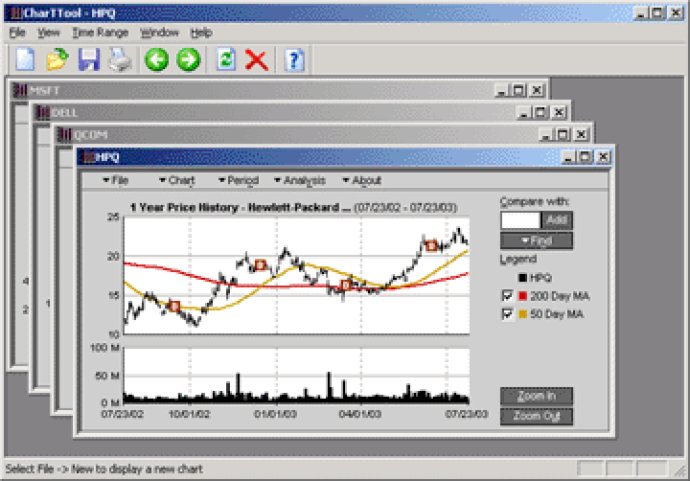
CharTTool is an advanced software for stock market charting that enables you to create technical charts for stocks, mutual funds, currency and market indices in intraday or end of day chart formats. It also includes technical analysis features.

The list of technical indicators available on CharTTool includes Bollinger bands, price channels, moving averages, fast and slow stochastic oscillators, relative strength index, MACD, trading volume, and others. This software also allows users to print multiple charts and export historical stock quotes.
One of the standout features of CharTTool is the ability to overlay charts for different equities, making it easy to compare different stocks or funds. Users can also store stock chart sessions in stock symbol list files, which is a convenient way to organize your charts and workspaces.
The latest version of CharTTool supports charting for stocks listed in major international exchanges, including Australia, Canada, France, Germany, Great Britain, Italy, Japan, Netherlands, Spain, and Sweden. This makes CharTTool a great choice for traders and investors who want to keep track of global markets and stay ahead of the curve.
Overall, CharTTool is a top-notch stock charting software that offers advanced features and a user-friendly interface. Whether you are a seasoned trader or a beginner, CharTTool is a must-have tool for tracking and analyzing stock data.
Version 2.22: Bug fixes, installer changes and user interface updates