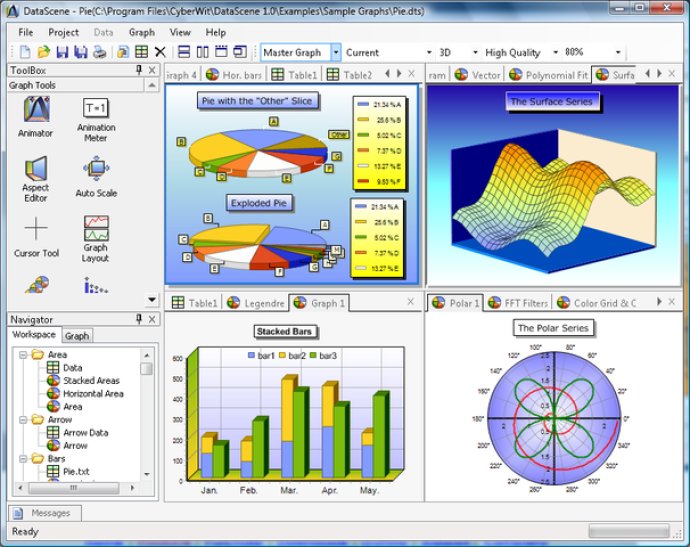
DataScene is a comprehensive software that provides scientific graphing, data analysis, and monitoring capabilities. It can plot a wide range of 2D and 3D graphs, create animations from data and models, perform data analysis, and visualize real-time data.

With 39 types of graphs to choose from, DataScene provides brilliant quality graphics, including 3D canvas for most graph types. Customization is key and users can utilize a wide variety of graphical elements to make their graphs truly unique, such as transparent colors, gradient brushes, hatch brushes with 56 textures, visual aspect settings, shadows, and more. Additionally, the software is easy to use with the ability to manipulate, print and export high quality graphs, making it perfect for presentations, classes, and web pages.
Data analysis is another important feature of this software, allowing users to apply mathematical methods such as fitting curves, calculating statistics, FFT and more. Plus, there is a powerful math parser that supports various built-in mathematical and text functions plus the program allows you to process graphs with various methods including Cublic Spline, Moving Average, Integrate, Differentiate, FFT, Curve Fitting, and more.
One of the key features of DataScene is the ability to create animated graphs for presentations, classes, and web pages using time-dependent mathematical formulas and sequences of data making it a versatile tool. The software also has the ability to monitor, chart and process real-time data, making it an excellent choice for researchers.
Overall, DataScene provides a super clean, friendly, context-sensitive, and configurable user interface with a rich set of graphical and data tools. Moreover, the software provides automatic graph update and result recalculation upon data source change, making it an efficient and hassle-free tool for data analysis and graphing.
Version 3.2.3.9: Fixed docking window refresh issue on 64-bit Windows OSes.
Version 3.0.7.15: Bug fixes and code optimization.
Version 2.0.6.10: Bug fixing and code optimization; added support for plotting a range of contour levels.
Version 2.0.4.6: Bug fixing for 2.0.2.3. See also http://www.cyber-wit.com/onlineHelp/release_notes.htm.
Version 2.0.2.3: Added click support for axis titles and labels and drag support for chart titles; added grid interpolation for the Color Grid series; data files can be shared among DataScene on different OSes. See also http://www.cyber-wit.com/onlineHelp/release_notes.htm.
Version 1.8.8.16: Code optimization for plotting sparse data tables and several built-in functions.
Version 1.8.1.1: Add support for importing ODF files and Microsoft Access databases; added conversions between matrix data and XYZ values; evaluation period changed to 45 days.