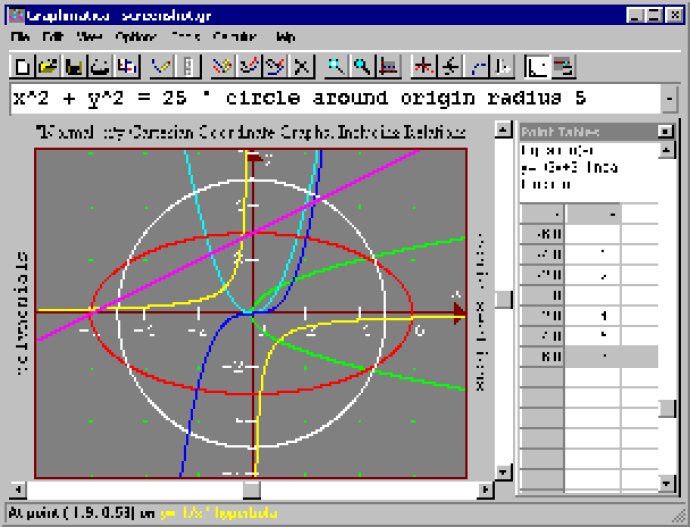
This software is a combination of a powerful and user-friendly equation plotter that also includes numerical and calculus functions. It allows users to easily manipulate and graph equations with higher-level mathematical features, making it a useful tool for professionals and students alike.

With the capability to graph Cartesian functions, relations, and inequalities alongside polar, parametric, and ordinary differential equations, you can visualize complex equations with ease. Additionally, our software allows up to 999 graphs to be displayed on screen simultaneously.
Experience the benefits of our new data plotting and curve-fitting features, which enable you to numerically solve and graphically display tangent lines and integrals. Identify critical points, solutions to equations, and intersections between Cartesian functions based on the information displayed on the graph.
Maximize the impact of your work with the option to print or copy your graphs to a clipboard as bitmap, enhanced metafile in black-and-white or color or export it to JPEG/PNG file. With on-line help and demo files, you can get started quickly and effectively, making this the ideal tool for students and teachers alike.
In summary, our software is an excellent resource for anyone from high-school algebra students to college calculus professors.
Version 2.4: anti-aliased graphs/semi-transparent shading, improved error reporting