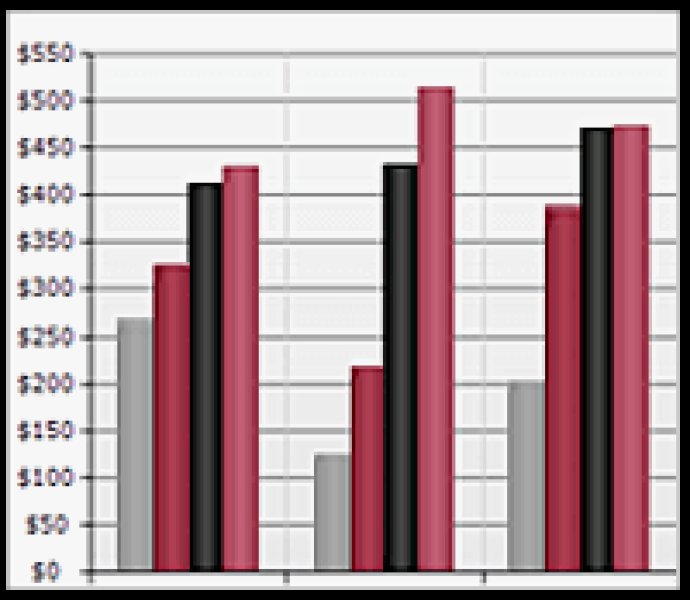
Nevron Chart for SharePoint is a comprehensive web part that provides an extensive variety of 2D and 3D charting options, customizable axes, complex data analysis, advanced customization settings and captivating visual effects for your SharePoint pages.

The product provides a complete set of 2D and 3D charting types, advanced Axis Model, Pivot Data Aggregation and Data Analysis. It is capable of displaying a wide range of Business Intelligence, scientific and presentational out-of-the-box charts that can be bound to different data sources such as ODBC, OLEDB, SQL Server and the SharePoint Business Data Catalog.
One of the main advantages of Nevron Chart for SharePoint is its complete configurability through an advanced, pure HTML based chart designer. The chart designer is designed to support all major web browsers without requiring any plug-ins such as Silverlight or Flash. This means that the software does not use postbacks, MS ASP.NET controls or MS AJAX, which ensures that the Client-Server communication is minimized. The client-side is just HTML, CSS and jQuery JavaScript, while the server-side UI processing is pure HTML and script rendering.
Nevron Chart for SharePoint features seamless integration in MOSS and WSS, superior set of 2D/3D charting types, unique pivot charting capabilities, web-based configuration interface, and binding to diverse data sources. In summary, Nevron Chart for SharePoint is a powerful software that stands out for its advanced charting functionality, configurability, and seamless integration in SharePoint environments.
Version 2022.1: Nevron Chart for SharePoint 2022.1 introduces New Ternary Char Type; New Point Series Dropline; New Bar Connect Lines; New Float Bar Connector Lines; New Heat Map Contour Lines; and TimeSpan Scale new features.