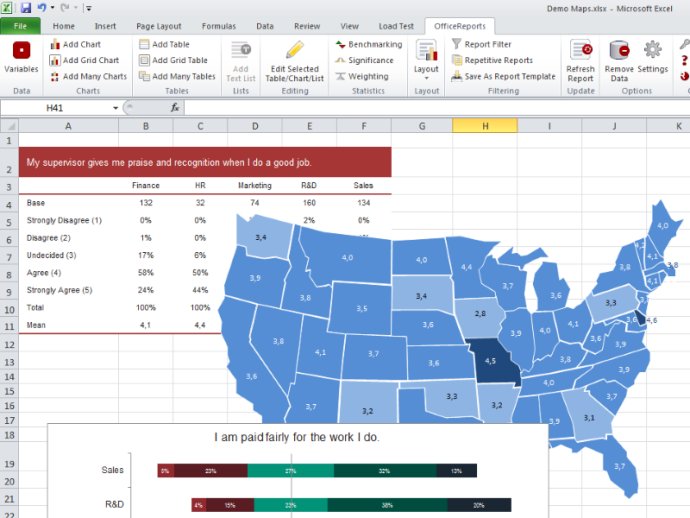
OfficeReports simplifies the process of designing custom charts and tables in Excel, and offers support for data from Excel, SPSS, and SurveyMonkey surveys, along with statistical analysis.

More advanced users will also appreciate the additional functionality offered, like weighting and various statistical tests. But what I found most compelling is OfficeReports’ ability to save users time. Once you define your layout definitions, they are available for all users and all presentations and documents. And in terms of data reuse, almost everything users define can be reused, making future projects less time-consuming.
Lastly, sharing reports is made easy thanks to OfficeReports’ ability to embed data directly into workbooks. Reports can easily be sent to colleagues for collaboration purposes, and sensitive data can easily be removed before sharing reports externally. Overall, OfficeReports offers a comprehensive solution for statistical analysis and report creation. Highly recommend.
Version 6.0: Create a complete analytics report with many tables in just a few click.