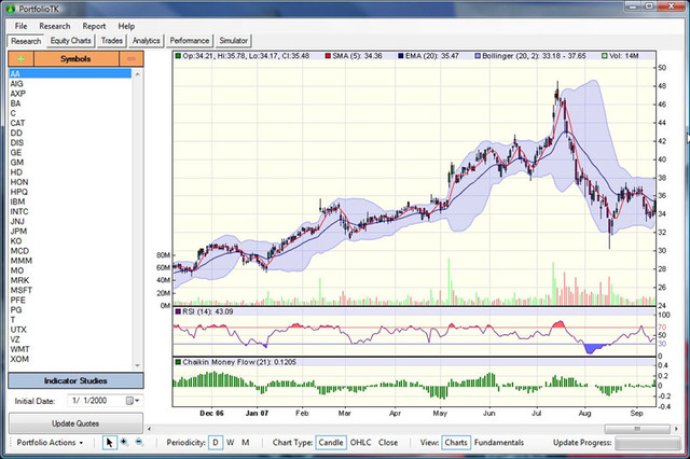
PortfolioTK is a stock portfolio management software that offers precise quantitative analysis and innovative charting visualization to investors.

One of the key features of PortfolioTK is its overall portfolio equity curve performance with risk analysis. This allows you to monitor your portfolio's performance over time and assess its risk levels. You can also use its trade log entry to track your trades and support partial position matching for both long and short trades.
In addition to these features, PortfolioTK offers a charting database with over 35+ technical indicators. This provides you with greater insights into the stock market trends and movements.
Overall, PortfolioTK is an excellent software that helps you manage your stock portfolio more efficiently. Its reporting features allow you to see how your portfolio has been performing against the major benchmark indices. With its advanced charting and analytics capabilities, it's definitely worth considering for any serious investor.
Version 1.10: -Redesigned charting/research interface. +create, edit, and store securities in a local database. +Multi-threaded historical quote download built-in. +Quicker chart loading and switching. +Panning, zooming, and scrolling of chart. +Can specify chart periodicity (Daily, Weekly, Monthly). +Able to edit indicator parameters (right clicking the chart. brings up a context menu to edit indicator params and remove). +Able to add more than two indicators (double click the. name of the indicator you would like to add to the chart). +Fundamentals tab browsing now much easier and cleaner. -New Preferences menu under the File menu. -Polished up the interface, as well as, rearranged main tabs to . reflect greater future emphasis on charting. -Slightly improved loading time. -Can now start the program without being connected to the internet. -Bug fixes in the new trade interface along with easier date entry. Also, sorting by date now works properly. -Able to export trade list to a comma separated .CSV file. -Manual has been updated to reflect new features. -New statistics in Monte Carlo simulator. +Probability of Profit/Loss. +Van Tharp's $ Expectancy Per Trade. +Van Tharp's $ Expectancy Per $ Invested. . Amibroker Users: To make the interface more intuitive, the Amibroker. Plugin is now disabled by default. If you are an Amibroker user, go. to File->Preferences menu and tick the Enable Amibroker Plugin.
Version 1.07: -Fixed a few bugs that users were experiencing.
Version 1.06: -Added Modern Portfolio Theory statistics (alpha, beta, r, r-squared). -Added two new charts in performance tab. +Quadrant chart: Alpha / Beta of portfolio against indices. +Scatter graph: Correlation between index and portfolio. monthly % returns. -Fixed an issue that would cause the program to crash when exporting. charts under some situations. -Added a few dialog boxes to make sure your account is saved before. moving to the next task. -Changed some visual elements of the user interface, as well as, improved usage functionality. -Monte Carlo equity curve graph now uses linear scale. This corrects. distortion present when tests were run with a high Positions Per . Trial # set. Linear scale makes sense as compounding effects are. not considered in the Monte Carlo Simulations.