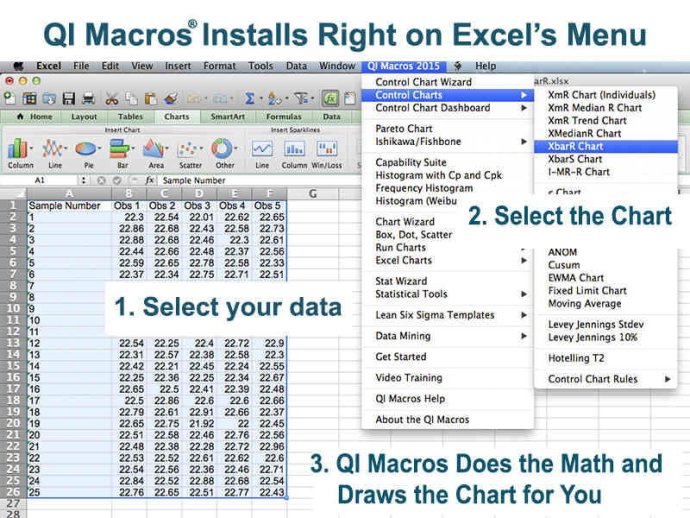
The QI Macros is an Excel add-in that provides affordable and user-friendly SPC functionalities. It enables users to create pareto charts, control charts, histograms, box and whisker plots, scatter plots, and other charts with ease. Statistical tests and automated fishbone analysis are also available.

With over 100 Lean Six Sigma fill-in-the-blank templates that include automated fishbone diagrams, value stream maps, QFDs, DOEs, FMEAs, PPAP forms, and MSA Gage R&Rs, QI Macros simplifies and streamlines the process of conducting statistical analysis. The software's Grab-It-And-Go simplicity and mistake-proof selection of data make it an ideal solution for business environments.
The software seamlessly handles data that is connected or separated, in rows or columns. QI Macros wizards go beyond what is available in similar software solutions, offering advanced and intuitive functionality. For instance, the Control Chart Wizard selects and runs the right control chart for users, while the Pivot Table wizard analyzes data and creates a pivot table for them. Additionally, the Data Mining wizard automatically creates control charts and Pareto charts from a spreadsheet with just one click.
Mistake-proofing your Six Sigma data and statistical analysis has never been easier than with QI Macros. The Statistical Wizard selects the right statistical tests and even interprets the results for users. The software also offers compatibility with PC and Mac, Excel 2010 to 2016 and Office 365.
Over 100,000 users at 2,500+ hospitals and thousands of manufacturing companies worldwide trust QI Macros for its robust features and ease of use. With a single user perpetual license with no annual fees, QI Macros offers excellent value for money. Academic and quantity discounts are available for purchase. The software also includes free technical support and free training resources.
For those who want to try out the software before committing, a free 30-day trial is available for download on their website at qimacros.com.
Version 2018-04: PC, Mac, Excel 2016, Office 365 compatible | Automated Value Stream Map | Data Mining Wizard 2.0 creates pivot table, control chart, defect Paretos + a fishbone diagram with one click. | MODAPTS template | XbarR real time template parses data from gages | Eliminated chart title prompts to speed up
Version 2016-08: PC, Mac, Excel 2016, Office 365 compatible | Data Mining Wizard creates a pivot table, generates an XmR chart and defect Paretos | 3 Legged 5 Whys Template, Short Run Control Charts | Enhanced Gantt Chart | Sample Size Calculator | Pooled Standard Deviation now the default estimator for Cp Cpk.