The Stock Market Prediction Application predicts market trends and turning points using price and time data sets in Forex and Stock markets. Designed for traders and investors, the lightweight software makes predictions with ease.

The interface of the application is simple and features buttons, checkboxes and multiple tab pages all bundled in the same window. To begin, you need to load data from an Excel or CSV file. The application displays columns of each entry from the data file. Sample data is provided within the downloaded archive that can be used to test the software's functionality.
Once data is loaded, you only need to press the button that performs fractal decomposition. The application will then generate fractal cycle analysis, performing calculations and plotting interactive evolution charts. The ZigZag indicator is plotted for different transaction cycles, and the application assesses the probability of price turning.
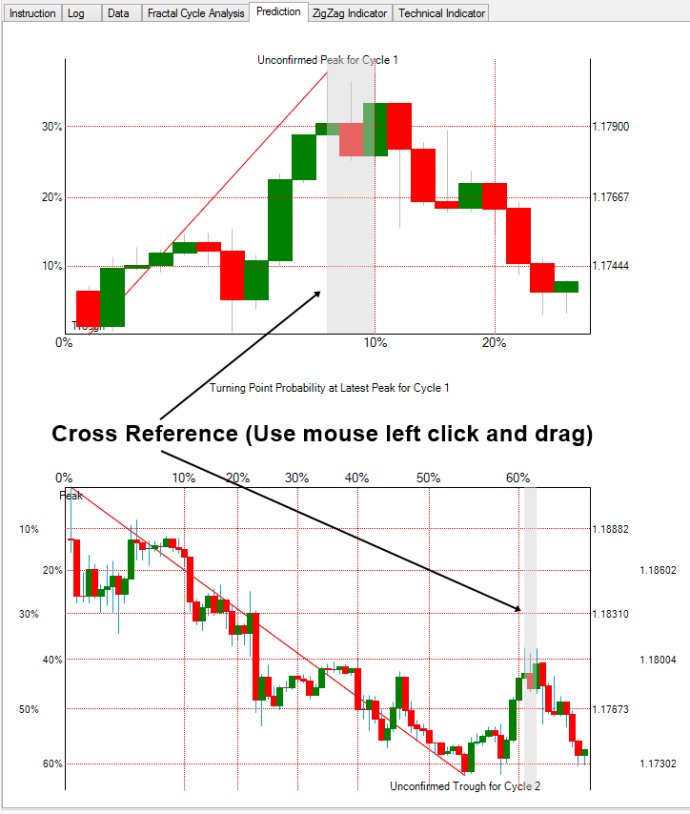
In the Prediction tab page, this application generates various charts for the turning point probability at the latest peak and trough, for multiple transaction cycles. The ZigZag indicator is a good reference when it comes to changes in price trends. This indicator plots points whenever the price reverses by a percentage greater than a specific value. Its evolution can help investors detect price trends and reduce price fluctuations as much as possible. A table containing various technical indicators is also generated which can be helpful in predicting future price movements.
Overall, Stock Market Prediction Application is an excellent software tool that helps in predicting the Stock market, and can also be used for predicting the Forex market. The software provides statistical predictions, various technical indicators, zigzag indicator for multiple cycles, and Fibonacci price projections. Lastly, this software is free to use.
Version 7.8: N/A