StockChartX imports, displays and saves stock data in XML format. It is an essential tool for developing financial apps with interactive data analysis.

With StockChartX, developers can integrate our lightweight COM-based ActiveX stock chart control seamlessly with their existing code. StockChartX is easy to use, allowing developers to quickly create both desktop and web charting applications using VB, VB.Net, C#, Excel, VC++, and Delphi.
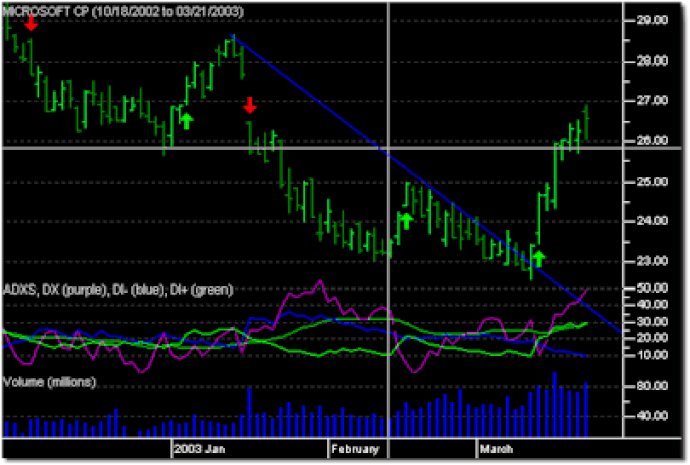
StockChartX is specifically designed for financial software engineering, meaning that it offers features tailored to the needs of traders and financial applications. Built by traders, for traders, StockChartX provides real-time stock data, embedded objects like buy, sell, and exit symbols, custom bitmap symbols, text, trend lines, drawings, multiple indicators, overlay indicators, semi-log or linear scaling, charts that can be printed, saved as images, or saved and loaded as binary files, and much more.
Using StockChartX as your go-to front-end data analysis tool, developers can quickly and easily create interactive financial applications, adding a powerful and versatile tool to their financial engineering toolbox. The StockChartX V.5 Pro comes with VB6, VC++, VB.net, C#, Delphi 7, Borland C++ Builder, and Excel example projects that contain 1,000 to 2,000 lines of highly commented source code, providing an excellent starting point for any financial development project.
Version 5.8: New product