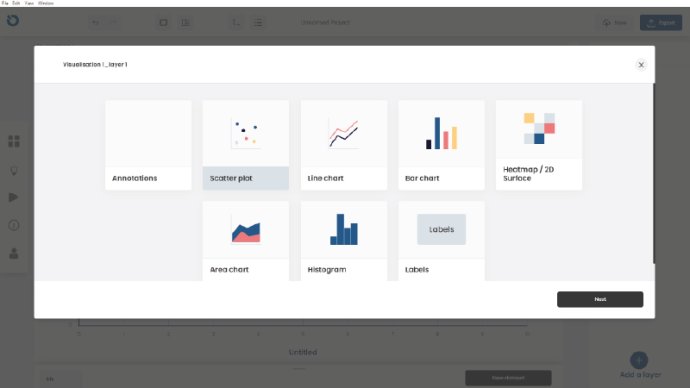
ZENPLOT is a specialized data visualization software that empowers visual creation through different graphic layers such as histograms, scatterplots, bar charts, line charts and more. This helps produce impressive and effective data visualizations.

Notably, navigating through this software's user-friendly interface is a breeze; the user has the option of annotating visualizations with images, text, or shapes. Every graphic made through ZENPLOT is exportable to the vectorial or standard format. ZENPLOT is available on both PC and Mac, and the software's intuitive interface requires very little learning.
ZENPLOT has several exporting formats (.PNG, .SVG, etc.) for the visualizations, making their inclusion in presentations seamless. Furthermore, the user can share their projects and visualization templates simply by saving them in the (.ZEN format). A project can consist of one or more visualizations, and each visualization can have one or more layers linked with datasets.
The user can customize each feature of each element of the visualization, such as the size, color, shape of a point, and so on. There are two ways to do this: universally for the layer or by linking it to a variable. ZENPLOT includes various themes that allow the user to beautify visualizations in no time.
The user can annotate their visualization with shapes, text, or images for the maximum creative freedom. Also, the reading axes and the legend of the visualization are customizable to a great extent. ZENPLOT, being a data visualization software that provides numerous and powerful features, is a great tool for creating impactful graphics for professional presentations.
Version 1.1.0.163: Fixes and improvements.
Version 1.1.0.158: Fixes and improvements.
Version 1.1.0: Fixes and improvements.
Version 1.0.8: Fixes and improvements.
Version 1.0.6: Fixes and improvements.
Version 1.0.5: Fixes and improvements.
Version 1.0.3: Fixes and improvements.
Version 1.0:
All features included in ZENPLOT®:
Annotation layer,
Scatter plot,
Line chart,
Bar chart,
Heatmap or 2D surface,
Area chart,
Histogram,
Labels