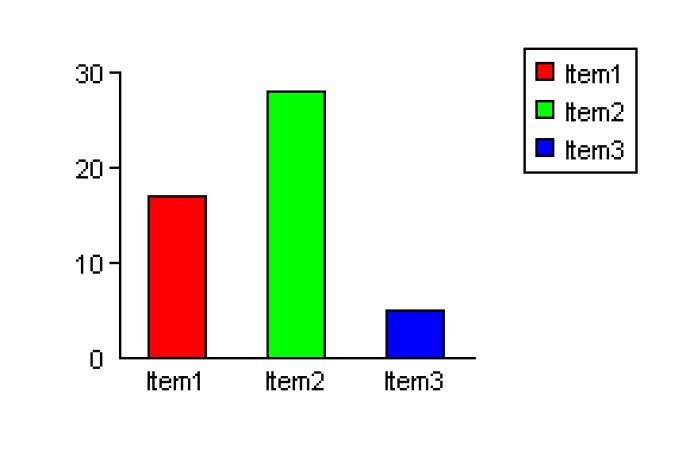
This ActiveX control lets users draw 2D graphs (pie charts, line graphs, and bar charts) with color and font control. It works for 32-bit and 64-bit systems and allows exporting to files or data streams, copying to the clipboard, and comes with a free trial.

The software also gave me the option to export my outputs as binary data for web applications or copy them to my clipboard. The range of properties available to tweak was impressive, from colors and fonts to formatting and layout. I appreciated the flexibility to create graphs with random colors when I needed to and the ability to display percentages or numeric values.
If you need to display multiple lines, the line graph function has you covered. Additionally, you can choose to hide the lines to create a scatter diagram instead. The stacked bar chart function allows users to draw multiple data items in each bar with legends for easy reference.
One feature that caught my attention was the ability to show trend lines on bar charts, giving me an even better visual representation of my data. The software is available as both 32-bit or 64-bit and comes with a signed CAB file for client-side applications.
To top it off, there's a free trial available so you can test it out before committing to purchase. Overall, this software was a great addition to my toolkit and I'd highly recommend it to anyone who needs to create 2D graphs.
Version 2.0: Update links to https.