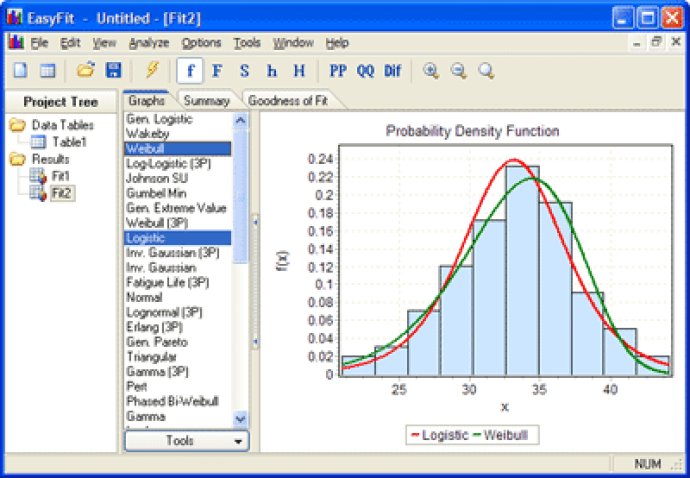
EasyFit enables fast and efficient analysis and simulation of data with more than 55 probability distributions. Choose the best model and apply the results easily while reducing your analysis time. It can be used as a stand-alone application or with Microsoft Excel.

One of the key features of EasyFit is the ability to automatically fit over 55 distributions to sample data and select the best model. Advanced users can apply the manual fitting feature as well, depending on their specific needs. With the goodness of fit tests, Kolmogorov-Smirnov, Anderson-Darling, and Chi-Squared, it's easy to compare the fitted distributions and ensure you have selected the most accurate model for your analysis.
In addition to these tests, EasyFit also includes a variety of graphs including probability density, cumulative probability, survival, hazard, P-P plot, and Q-Q plot. These graphs help you visually compare the fitted distributions and select the most valid model.
Another unique feature of EasyFit is the ability to apply the integrated StatAssist tool to make business decisions based on the analysis results. With this tool, you can easily tailor your analysis to your specific business needs and make the best decisions possible.
For those familiar with Excel, EasyFit also offers advanced Excel integration. With this feature, you can use the power of EasyFit directly within Excel. This is useful for performing worksheet data analysis and simulation, creating advanced worksheet models, and developing VBA applications dealing with uncertainty.
EasyFit is designed to support a wide variety of distributions including Bernoulli, Beta, Binomial, Burr, Cauchy, Chi-Squared, Dagum, Erlang, Error, Error Function, Exponential, F Distribution, Fatigue Life, Frechet, Gamma, Generalized Gamma, Generalized Extreme Value, Generalized Logistic, Generalized Pareto, Geometric, Gumbel, Hyperbolic Secant, Hypergeometric, Inverse Gaussian, Johnson SB, Johnson SU, Kumaraswamy, Laplace, Levy, Logarithmic, Logistic, Lognormal, Log-Gamma, Log-Pearson III, Nakagami, Negative Binomial, Normal, Pareto, Pareto 2, Pearson 5, Pearson 6, Pert, Poisson, Power Function, Rayleigh, Reciprocal, Rice, Student's t, Triangular, Uniform, Wakeby, and Weibull. In short, EasyFit has everyone covered when it comes to probability distributions.
Version 5.0: 15 new distributions, new Excel worksheet & VBA functions.
Version 4.0: Advanced Excel Integration.
Version 3.2: Support for discrete data, 16 new distributions, Chi-Squared test, sample percentiles, distribution quantiles, random number generator, integrated distribution explorer, visual distribution gallery. The user interface is now available in English, German, French, Spanish, and Italian. The Japanese version is available as a separate package.
Version 3.0: Support for discrete input data, 16 new distributions, Chi-Squared test, sample percentiles, distribution quantiles, random number generator, integrated distribution explorer, visual distribution gallery.
Version 1.3: Support for 18 new distributions, two new graph types, manual fitting capability, export graphs and tables.
Version 1.2: 9 new distributions added, improved visualization of graphs.
Version 1.1: N/A