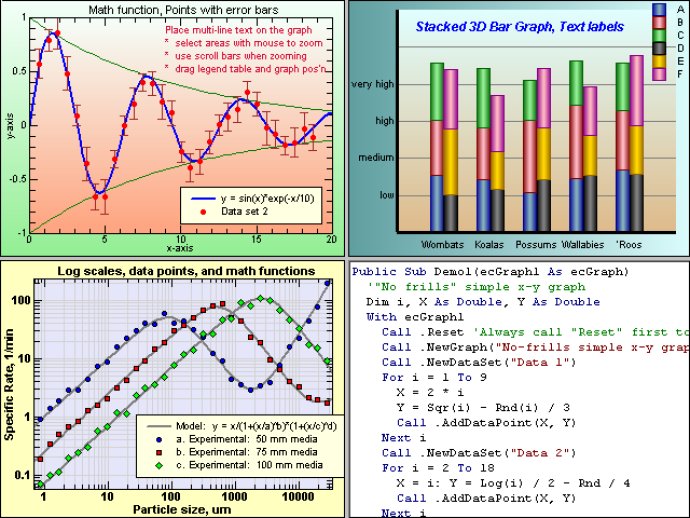
Create complex scientific or technical graphs quickly using a versatile ActiveX control. With just a few lines of code, you can generate numerous graphs with intricate styles and tweak their layout during runtime. The software allows dragging, zooming, and scrolling for precise visualization.

With ecGraph, creating graphs is incredibly simple. You just need a few lines of code to get started, and you can manipulate the graph layout at runtime from your programs. It supports multiple graphs per page and allows you to click and drag to move or resize them on the page. You can also zoom and scroll areas of the graphs.
Moreover, ecGraph allows you to add multiple x- and y-axes per graph, choose between log or linear scales on the axes, plot data points, bars, and text, as well as plot continuous math functions like y = sin(x)*exp(-x/10). Additionally, you can plot data points against math functions, with vertical or horizontal optional error bars.
The software also lets you configure grid lines, tick marks, borders, and backgrounds. It features legend tables, reverse axes, and show/hide labels, and allows you to use transparent backgrounds. There are demo projects supplied to show you how all the features work, including Project1 - a simple viewer to load and display the demo graphs and the VB code used to generate them, and Project 2 - a comprehensive graph editing program that loads the demo graphs and lets you edit them on screen.
To sum up, ecGraph is a versatile and user-friendly tool that offers hundreds of features and allows you to create stunning graphs with ease.
Version 2.13: n/a