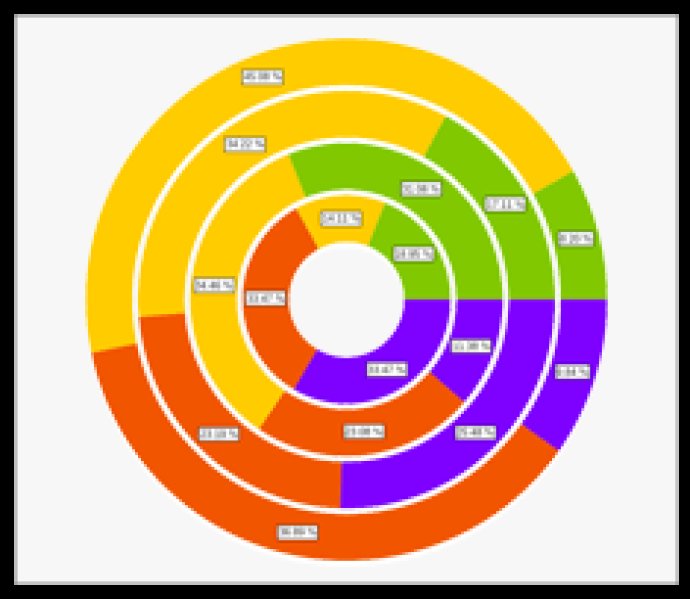
NOV Chart for .NET is a comprehensive charting control software for .NET, with a wide range of charting types for various applications such as business, scientific, financial, and real-time monitoring. It offers advanced features that promote better visualization of data.

Developers can create incredibly sophisticated, feature-rich interactive dashboards for Windows and Mac using this control - all from a single code base. There are a ton of impressive features available with NOV Chart for .NET, including data zooming, scrolling, panning and hit testing, blazing fast performance, superb image quality, and more.
Some of the other noteworthy features of this chart control include:
- A complete set of 2D charting types (with support for over 50 types).
- A highly advanced chart axes model, with categorical, linear, logarithmic, date time, and timeline axes.
- Non-overlapping data and axis labels to keep things organized.
- Resizable chart layout support with docking, anchoring, percentages and more.
- The ability to export charts to a variety of formats, including PNG, JPG, BMP, GIF, TIFF and PDF.
- Interactivity features like data zooming, data panning, axis scrolling, tooltips, hit testing and more.
- The ability to import charts into NOV text documents, or other NOV content.
All in all, NOV Chart for .NET is an incredibly powerful tool for .NET developers in need of advanced charting functionality. With its impressive feature set and ease of use, it's definitely worth checking out.
Version 2022.1: many bug fixes and improvements