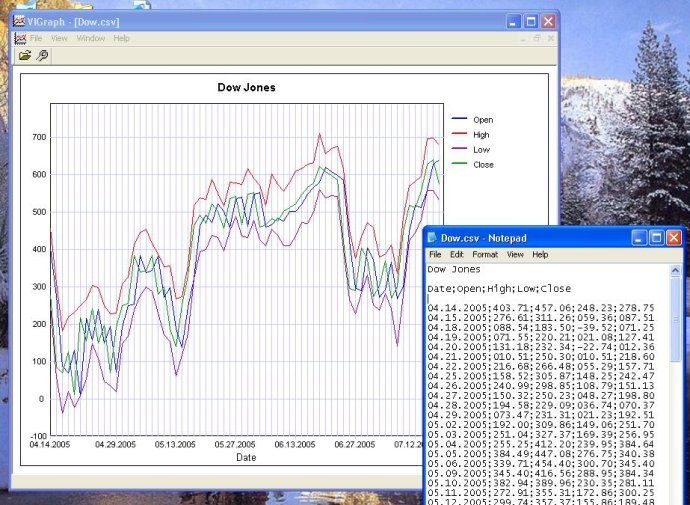
This software creates diagrams from text files and provides automatic or manual scaling options. Multiple text files can be opened at once, with the ability to divide columns by commas, tabulators, or semicolons.

The software is incredibly easy to use. Simply create a txt or csv (ASCII) file, such as one with Dow Jones data, and open it in VIGraph. The program will then create a diagram with four colored lines indicating the Open, High, Low, and Close data columns. The diagram's header will display "Dow Jones," and the horizontal axis will indicate the date.
VIGraph can open as many txt-files as you need simultaneously, and you can divide columns within the files using commas, tabulators, or semicolons. Additionally, you can access the parameters dialog to decide what information you want to see in your diagram.
Overall, VIGraph is an excellent software for anyone who needs to create diagrams from txt-data files. It's easy to use, highly customizable, and allows you to create visual representations of data in seconds.
Version 1.5: No changes