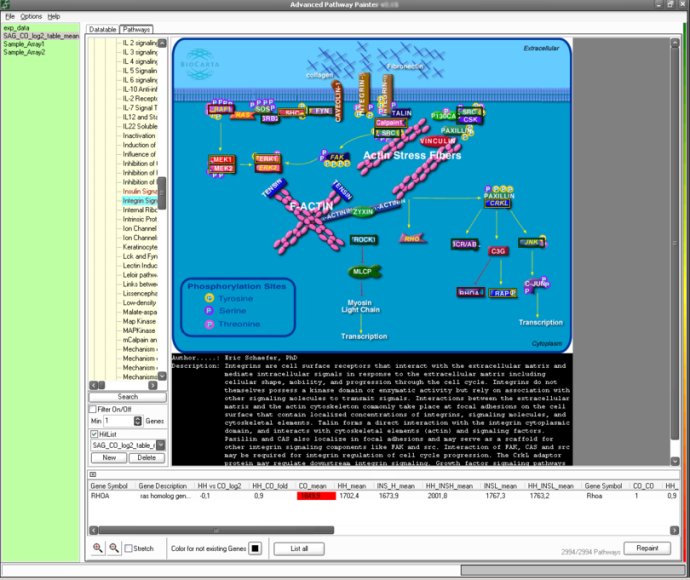
Visualize pathways with this software, displaying gene and protein data in colored values. Automatic updates from KEGG, BioCarta and GenMAPP for seamless integration.

One of the best features of this program is the ability to display quantitative data from gene and protein experiments directly within the pathways. This is done by representing values of experiments in different colours. Linking between the pathway items and experiment data is made possible through gene or protein names and their accession numbers.
With this program, you can also quickly check the gene/protein with the collected links in the web-interface, thanks to the direct links it provides.
It is worth noting that this program is not a full-featured software like GENOM 2005; it includes only a small part of its functions. Nonetheless, if you only need to visualize pathways and display experiment data, this freeware program is a great choice.
Version 2.30: gui bug fixed