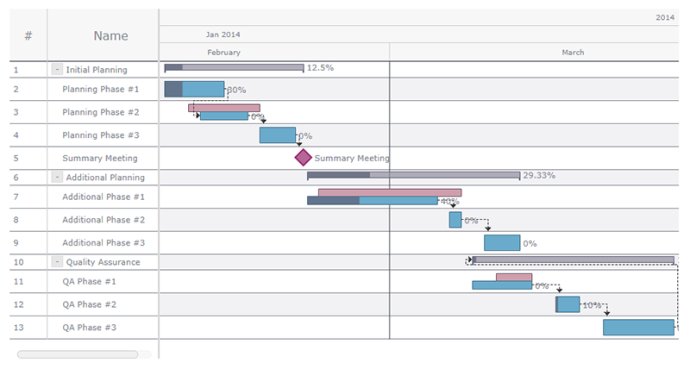
AnyGantt is a powerful JavaScript charting library that enables you to create HTML5 Gantt Charts with interactive animation, optimizing resource and project management. It is highly flexible and works seamlessly across different platforms and browsers.

One of the best things about this library is that it's fully cross-browser and cross-platform. It works seamlessly with ASP.NET, ASP, PHP, JSP, ColdFusion, Ruby on Rails or simple HTML pages. So, no matter the server or desktop platform you choose, AnyGantt will take care of the charting with ease.
What's more, AnyGantt is not picky about the data source you're using. It can work seamlessly with all sorts of sources from files in text, Excel, CSV formats to MySQL, MS SQL, and Oracle database servers. This flexibility makes it easy for you to visualize data from any warehouse.
AnyGantt has an impressive list of features that make it a must-have for anyone who needs powerful and informative charts. One of its most popular features is the Project (Task-based) and Schedule (Resource-based) Gantt charts, which are perfect for project planning. Other features include the PERT (Program Evaluation & Review Technique) charts for decision making, all with configurable Timeline, DataGrid, and other features.
Moreover, AnyGantt comes with a style-based visualization that allows developers to focus on the business logic. The nicely designed defaults ensure that design tasks are kept at bay. For all text-based elements, such as labels, tooltips or data-grid columns, AnyGantt features powerful formatting options.
The Data Grid that holds basic task or resource information is highly configurable. You can add any number of custom columns that can contain additional task or resource data. Each column can have custom text formatting, height, and text style settings. The data grid itself can be redesigned to reflect important data specifics.
Each element of AnyChart Gantt charts can be configured in its own way with the help of the flexible design system. AnyGantt is a JavaScript-based component that can be used in any Web project. It doesn't depend on any server-side platform, all you need is a JavaScript-enabled browser on the client-side. In conclusion, AnyGantt is a topnotch tool for anyone who needs powerful and informative Gantt charts with easy integration across different platforms.
Version 8.7.0: Client-side export - save data visualizations as images (SVG, PNG, and JPG) and PDF documents without a roundtrip to the server. Other new features in Gantt charts: Milestone preview on parent task bar. Custom markers for project activity milestones. Custom basic year (fiscal, academic, etc.).