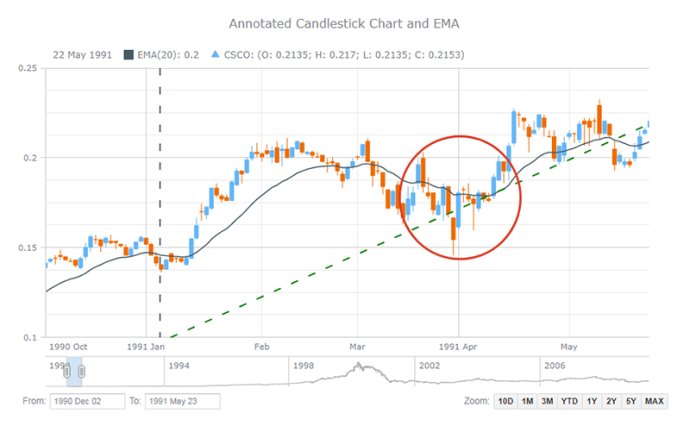
AnyStock is a JavaScript charting library that presents large data sets through interactive HTML5 charts. It is optimized for data related to date and time, has various chart types, drawing tools, and technical indicators.

AnyStock has been designed to display date and time based information, making it an excellent tool for analyzing FOREX, commodity, and investment market data. The ability to review long-term and large data sets can easily be handled with scroll, pan, and zoom controls. Reports and dashboards are visualized with scrolling, drill downs, panning, and zoom functionality available in all of our HTML5 charts.
One of the most significant advantages of AnyStock is its full integration into the AnyChart 7 Framework. This means that it shares most of its ideology, settings technique, and ease of use, and you can use AnyStock alongside other charts including those available in the AnyChart JavaScript Charts, AnyGantt JavaScript Gantt Charts, and AnyMap JavaScript Maps.
AnyStock supports a wide range of stock chart types including Candlestick, OHLC, Line, Spline, Column, Step Line, Area, Step Area, Spline Area, Marker, Range Column, Range Area, Range Spline Area, Stacked Stock JS charts. It also supports technical analysis indicators such as MACD, ROC, RSI, SMA, EMA, DMI, CHO, CCI, and other custom indicators that can be easily set up.
Other features available include drawing tools such as Line segment, Ray, Trend line, Trend channel, Andrew's pitchfork, Fibonacci fan, Buy/Sell signals, and many others. You can also add news events such as analyst opinions, insider trading, dividends, and key developments to improve the ability to analyze information effectively. All these features have contributed significantly to the super-fast HTML5 visualization of stock/financial or any timeline data with AnyStock JS. Overall, AnyStock is an excellent tool for anyone looking to visualize and analyze large sets of financial data easily.
Version 8.7.0: Client-side export - save data visualizations as images (SVG, PNG, and JPG) and PDF documents without a roundtrip to the server. Stock UI Controls: Swap (Up/Down) and Maximize. Stock Plot Splitter. New technical indicators for technical analysis: ENV, IKH, PPO, RCI, and PSY.